I would recommend an business intelligence developer to possess below skills as primary focus before starting/designing any dashboard.
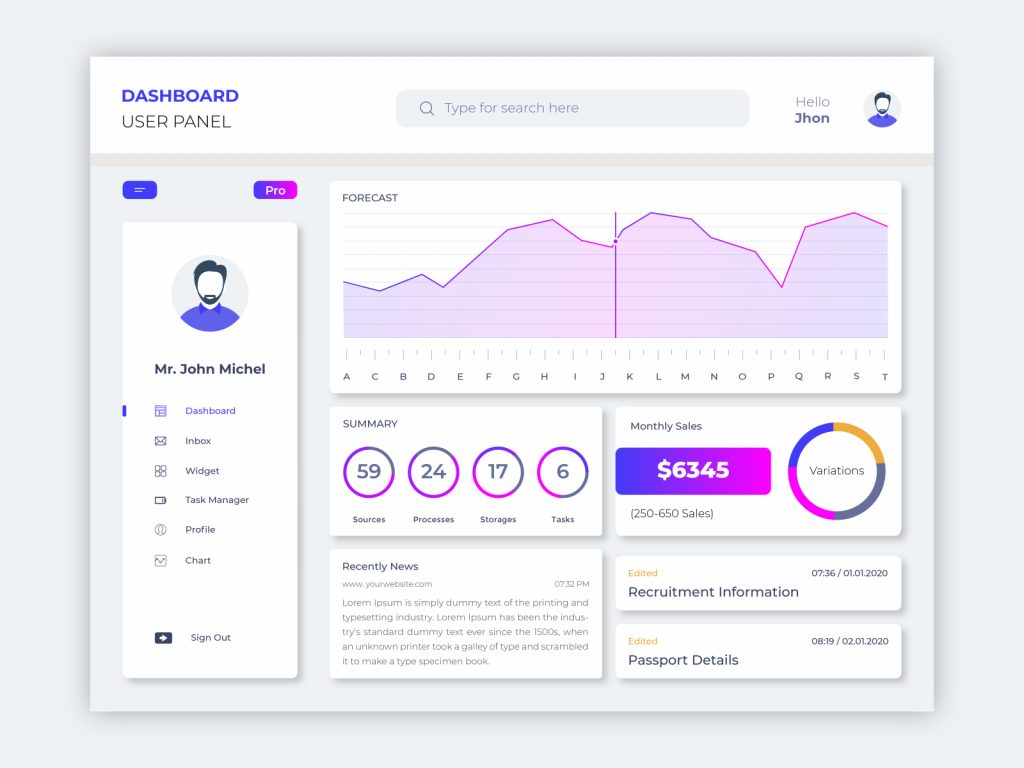
- Every Dashboard today should start with an wireframe (pencil/sketch or excel based design or power point or utilize Adobe XD or Balsamiq). Wireframe will act as base framework for your design to be focused on business needs and deliver with excellence – My favorite is to use Pencil/Sketch for quick delivery & if time is not an constraint, would recommend using Adobe XD. This is the fun part & i love doing this 🙂

- Less is more – Try to keep it simple and easy to understand the flow of business (choose relevant KPI)

- Try to use Navigation to switch between tabs or dashboards or reports or drilling to different dashboard (especially for Mobile iOS or Android devices/tablets)

- Be Creative and Innovative to add value for the business needs

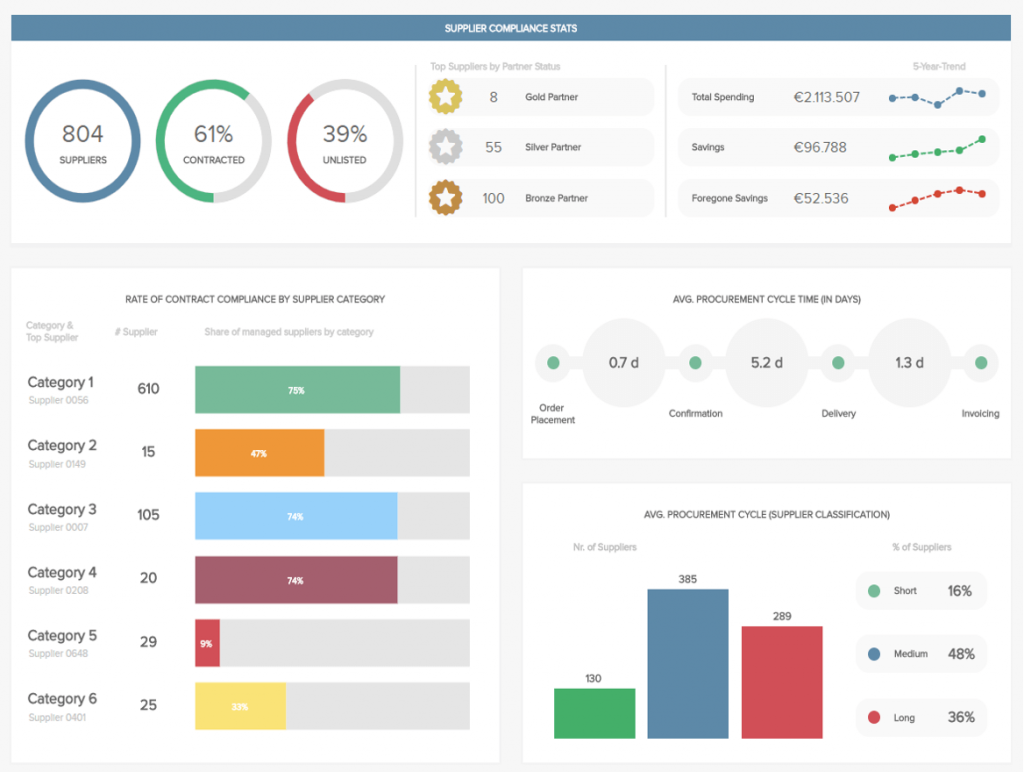
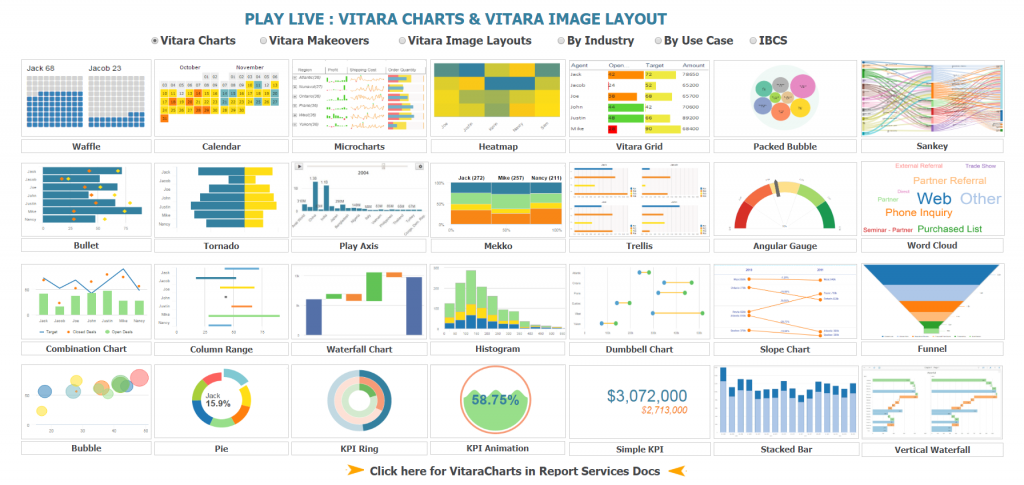
- Add meaningful visualizations to represent your data for the business needs

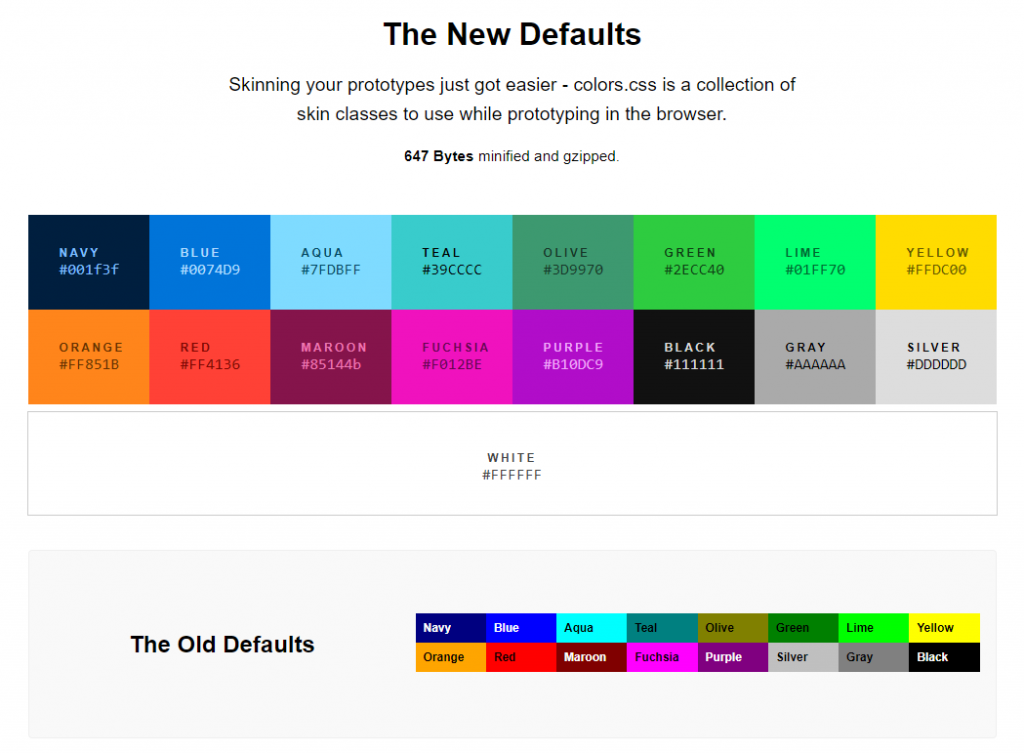
- Fonts & Color blind criteria to be considered – depending on the target audience follow standard fonts (Web UI, Web UI Bold, Veradana, Trebuchet MS, etc) & standard colors that covers colorblind users as well. Thumb rule – try to keep within 3 to 6 colors overall than having too many colors.

- Nowadays, business is expecting to develop once for all types of devices (Web & Mobile) – so keep that in mind and design your wireframe to ensure it covers an responsive design. Personally, would recommend to provide two wireframes considering the screen size and resolution as an factor. Mobile is small size while Web is bigger size/resolution. Key is have the dashboard designed to be responsive like using MicroStrategy Dossier or Tableau Dashboard with responsive design or Power BI dashboard that is responsive.
- Do not have the perspective of having apple to apple look and feel while taking existing business reports in focus. If information technology team have to build the dashboard, focus on using the right wireframe to cater the business needs considering current and future needs in focus than giving as-is design. Have constant conversation with business to deliver the best in class dashboard addressing business problems and help them grow eventually.

- Focus on having filters or selectors to slice/dice the data
- Famous image i came across online is below – I would recommend following it (which covers majority of my points as well)

- Information Window can be used for filtering or drilling to further granular level of data (good design principal from my experience) – if designed on MicroStrategy Document design
- Modern design is looking for asking queries on the fly allows users to bring the data/viz on-demand – so i wouldn’t be surprised to have your wireframe having an section for end users to ask queries to build viz by themselves in self-service model (Called as NLP – Natural Language Processing built with BI tool nowadays – supports in Power BI, Tableau, MicroStrategy or etc., )
TIP: If you ask me personally from the certification point of view, i would recommend taking “Application Architect” course provided by MicroStrategy which covers these things in detail an application developer or architect should possess. Take advantage of it at this COVID-19 situation. MicroStrategy provides free education until May-15, 2020.
Keep yourselves acquainted with modern dashboard design skills & help the business grow their business!
Enjoy Reading & Learning from the blog!!


Nicely articulated about the essential skills required for a dashboard designer.I am sure if anyone familiarise themselves those essentials definitely will produce a quality output of dashboards.
Thank you so much for your efforts Rajavel!