
Introduction about Power BI
Power BI is a business analytics service by Microsoft. It aims to provide interactive visualizations and business intelligence capabilities with an interface simple enough for end users to create their own reports and dashboard (which is termed in recent days as Self-Service analysis). This reduces the dependency on IT side and driven more by business.
My experience says, IT will still play crucial role collaborating with business to build an efficient/enterprise solution for the business use cases. (Let me stop here!J)
Data Connectivity Modes
Before we jump on these option, I would like to give some information about connectivity on Power BI. Any BI tool we work with, we work on data which can reside on the flat files (like text, csv, excel, XML or etc.) or stored on relational data base such as oracle, IBM db2, Teradata, SQL Server, etc., or stored on cloud such as Amazon Redshift, Azure SQL database, etc., or big data platforms such as impala, etc.
To establish connectivity to data coming from different sources, we go for any of these mode options available within Microsoft Power BI.
- Direct Query
- Import Data
- Connect Live
Here our focus is primarily on the DirectQuery Mode option for our readers.
Direct Query Connectivity Mode
Most common way to get data, or connect directly to data in its original source repository, which is known as DirectQuery. In short, Data will NOT be stored in Power BI model. Power BI will be a visualization layer only, then any interactions would query back for the data from data sources every time.
Power BI will only store metadata of tables (i.e. table names, column names, relationships, visual interactions links, etc.,) but not the data.
Below are cases when DirectQuery in Power BI offers benefits:
- Data is changing frequently, and near real-time reporting is needed
- Handling very large data, without the need to pre-aggregate
- Data sovereignty restrictions apply
- The source is a multidimensional source containing measures (such as SAP BW)
Implications of using DirectQuery
Limitations are generally to avoid performance issues Microsoft have explicitly listed it for customers to be aware of in advance than running into issues during the implementation.
I would recommend for BI Architects to keep these pointers in mind before deep diving on implementing any enterprise solution for customers.
- Performance and load on the underlying source
- Security implications when combining data sources
- Limited data transformations
- Modeling limitations
- Defining relationship between tables
- Adding new calculations
- Renaming and hiding columns and measures
- Defining hierarchies
- Defining the formatting, default summarization and sort order for a column
- Grouping or clustering values
- Reporting Limitations
- Quick insights is not supported
- Q&A is not supported
- Using explore in Excel will likely result in poorer performance
- Additional limitations
- No Built-in date hierarchy
- Date/time support only to second accuracy
- Limitation in calculated columns
- No support for parent-child DAX functions
- Calculated tables are not supported
- Relationship filtering (bi-directional filtering)
- No clustering (to automatically find groups)
Performance Deep Dive
Dashboard Refresh
When a dashboard with ten tiles, shared with 100 users, created on a dataset using “DirectQuery” with Row Level Security, and configured to refresh every 15 minutes, would result in at least 1000 queries being sent every 15 minutes to the back-end source.
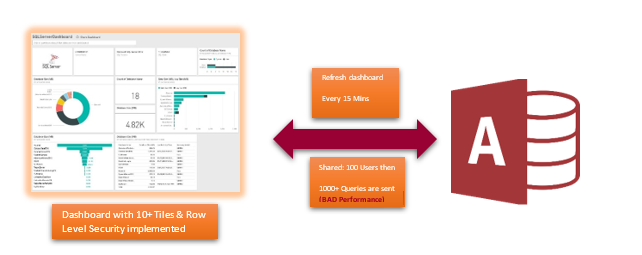
Note: If queries taking longer than 4 minutes will fail in Power BI service
Model Design Guidance
As an architect/developer, would recommend to ensure we follow below key areas to keep in mind
- Avoid complex queries in query editor
- Keep measures simple
- Avoid relationships on calculated columns
- Avoid relationships on unique identifier columns
- Examine all uses of calculated columns and data type changes
- Avoid use of bi-directional cross filtering on relationships
- Experiment with setting Assume referential integrity
- Do not use the relative data filtering in Query Editor
Report Design Guidance
When creating a report using DirectQuery connection, adhere to the following guidance:
- Consider use of Query Reduction options

- Apply filters first – this is key for better performance than fetching complete data from EDW. Apply the same for building an visual as well – go with applying filter first on year or time frame and then start including objects
- Limit the number of visuals on a page- this is key too, focus on key metrics than bringing everything
- Consider switching off interaction between visuals

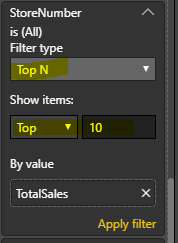
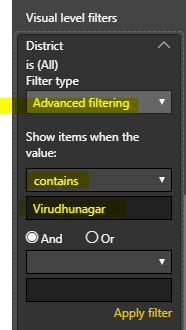
- Also evaluate below filters – which would
degrade performance
- TopN Filters
- Median
- Measure Filters

- Advanced Text Filters (‘contains’ and similar)
- Multi Select Filters

- Consider switching off Total on visuals

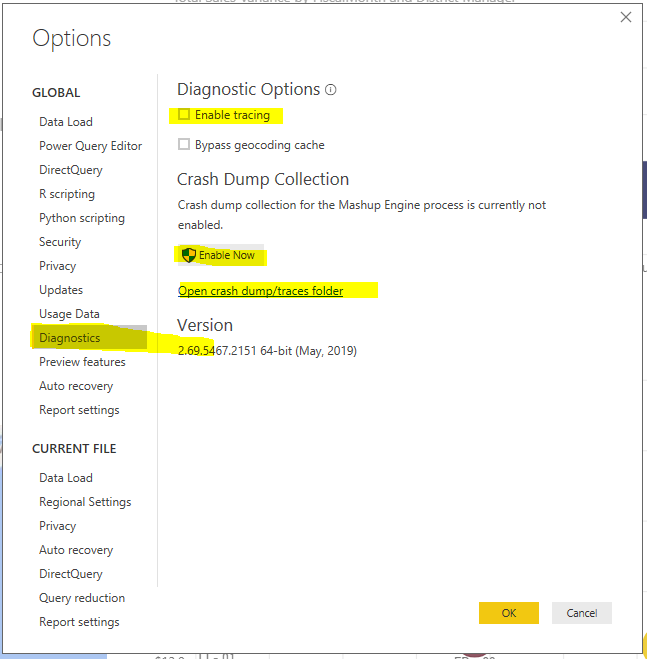
Diagnosis
Enabling this option in Power BI Desktop would be an good place to start troubleshooting any issues
Go to File è Options and Settings è Options, and then select “Diagnostics”
Data Sources Supported with Direct Query Mode
I would like to highlight below data sources are supported as of Oct, 2019 released by Microsoft

- Amazon Redshift
- AtScale (Beta)
- Azure Data Explorer
- Azure HDInsight Spark
- Azure SQL Database
- Azure SQL Data Warehouse
- Denodo
- Google BigQuery
- HDInsight Interactive Query
- IBM DB2 (Microsoft provider)
- IBM Netezza
- Impala (version 2.x)
- MarkLogic
- Oracle Database (version 12 and above)
- Oracle Essbase
- PostgreSQL
- SAP HANA
- Snowflake
- Spark (version 0.9 and above)
- SQL Server
- Teradata
- Vertica
More information about this data sources with direct query mode is available here. My highlight is the most prominently used data sources in day to day business case developments.
Post Reference & Credit: Microsoft KB1, Microsoft KB2