
1. Don’t wait for your source data from flat files to be perfect?
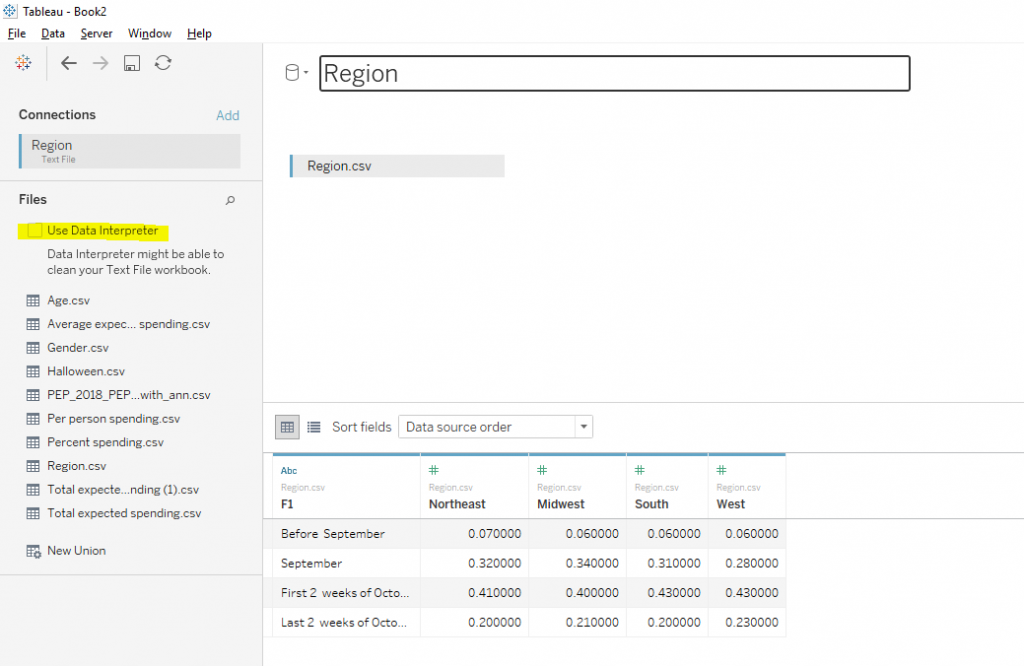
Data Interpreter can give you a head start when cleaning your data. It can detect things like titles, notes, footers, empty cells, and so on and bypass them to identify the actual fields and values in your data set.
It can even detect additional tables and sub-tables so that you can work with a subset of your data independently of the other data.Click on the Checkbox to prep your data

Ref: Video with detailed use case
If your data needs more cleaning or data stewardship, then go for “Tableau Prep Builder” – Combine, shape, and clean your data for analysis

Pic Credit: Tableau Site
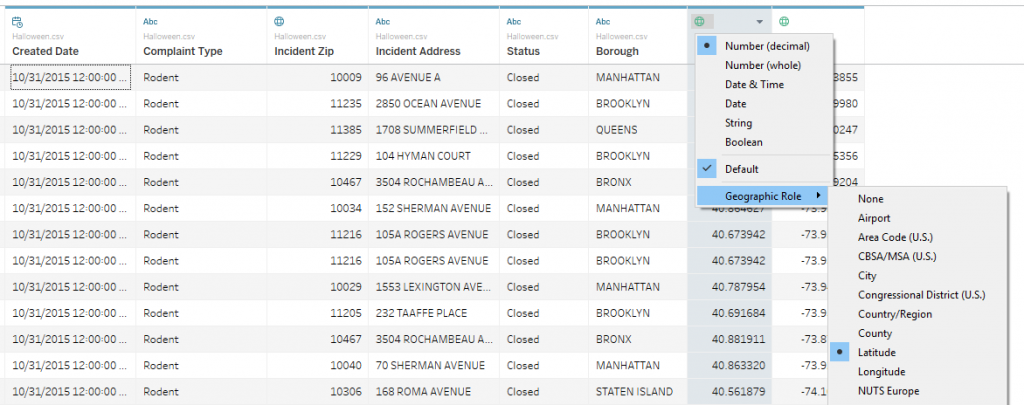
2. Auto Recognition of Data Types
3. Changing the aggregation of a measure
Right Click on the measure and change the desired aggregation.

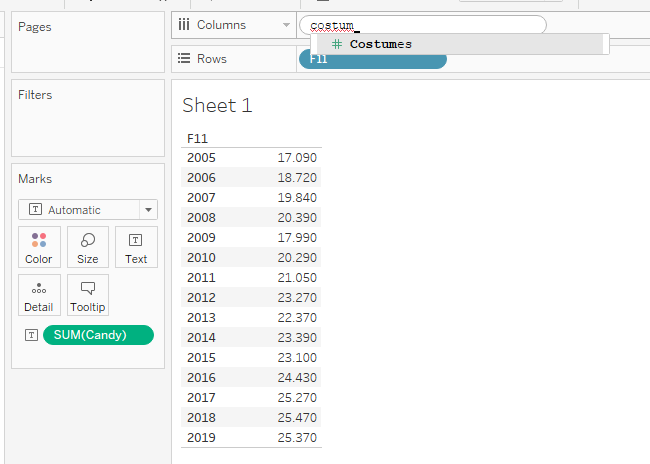
4. Adding a field directly on the view
You can add a dimension or measure to your view by typing directly into the column or row shelf
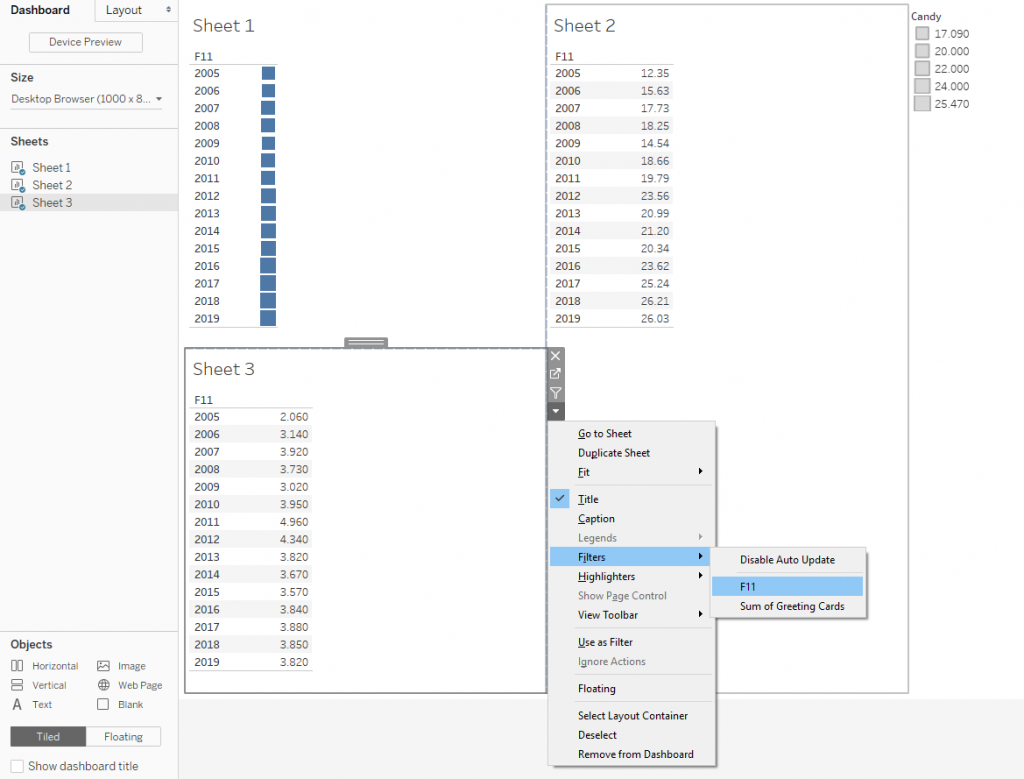
5. Adding filter to the dashboard
When you’re having dashboard with multiple worksheets and wondering how to bring the filter to the dashboard. Easy – select the worksheet on dashboard that is present. Right Click and Select Filters.
6. Avoid Clutter
When you build your dashboards, always don’t jump immediately by creating some charts, grids or viz. Work on making it less clutter and remove unwanted items from the dashboard which doesn’t provide clarity for analysis or not intuitive to navigate as well. Great post below written by Andy Cotgreave (Do gain knowledge on how to make it look better for end users!!)
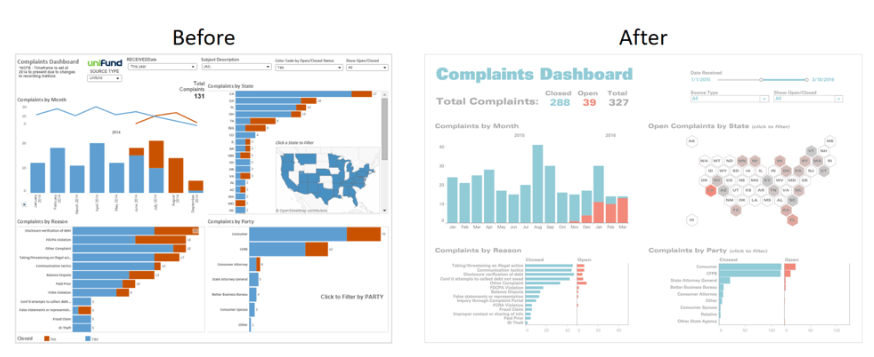
Credit: Andy Cotgreave