

The blog post is talking about the use of “MicroStrategy Freeform Layout” design in MicroStrategy 2020. Thanks to Ram in sharing this design (it was great working as a team of 4 [Ram, Niranjana, Reema & Myself] for our MicroStrategy World 2020 on DossBoss Competition. This is an Winning Dossier for exemplary design and MicroStrategy 2020 features being used.
Requirements:
MicroStrategy Desktop 2020 (or)
MicroStrategy Workstation 2020 (or)
MicroStrategy Web 2020 (enterprise edition)
Vitara Charts (for Advanced Visualizations)
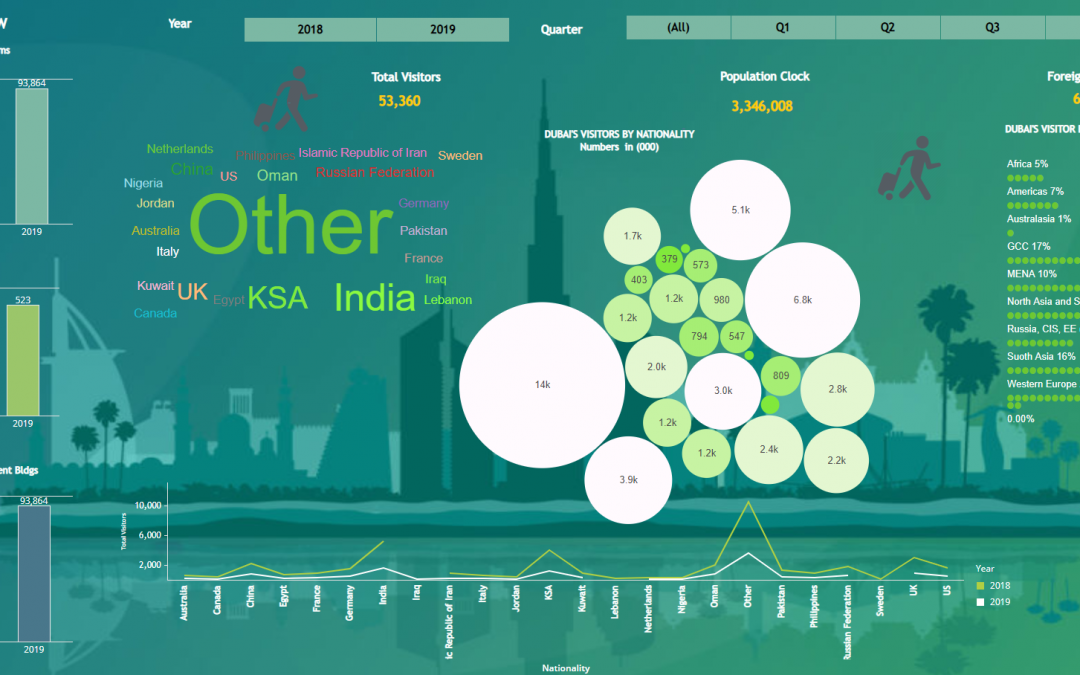
Dashboard was divided into 6 categories as below
Tourist Attractions
Quality of Transport Infrastructure
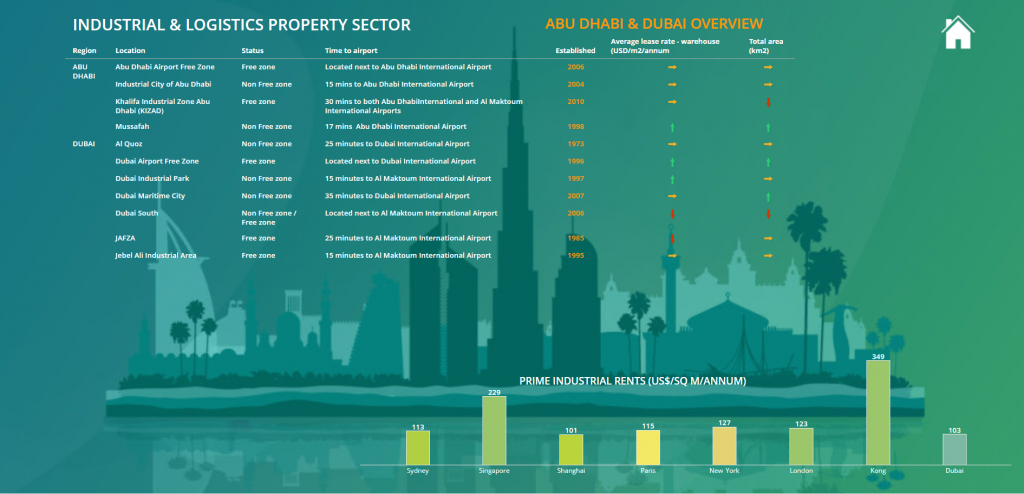
Industrial & Logistics Propriety Sector
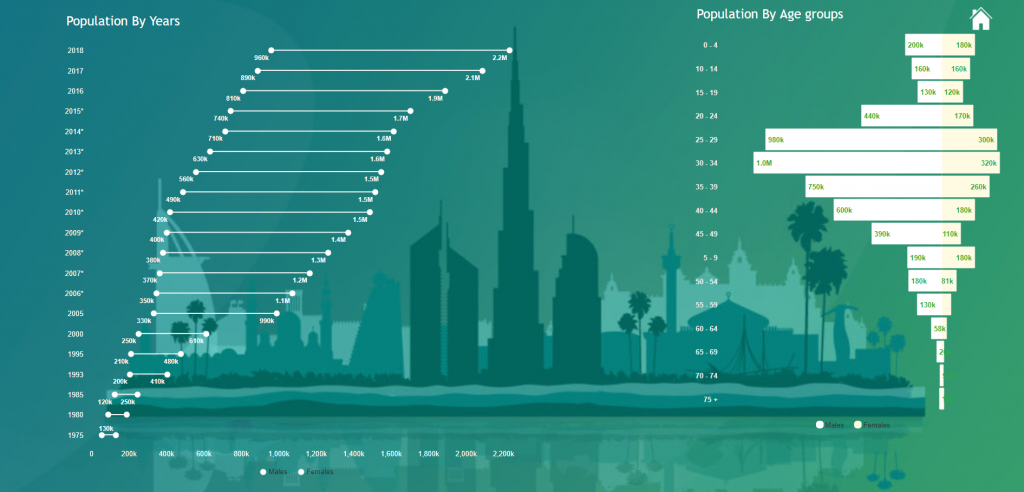
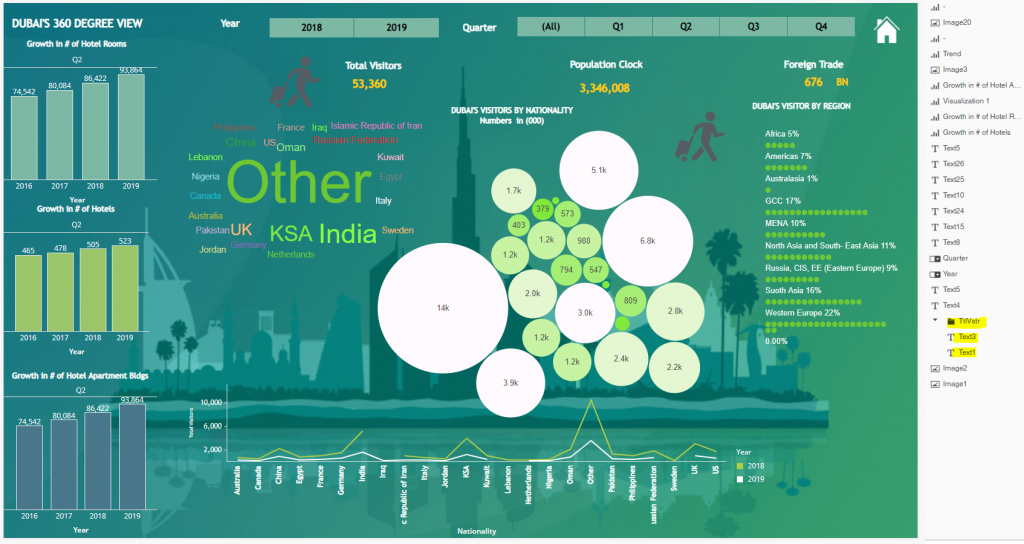
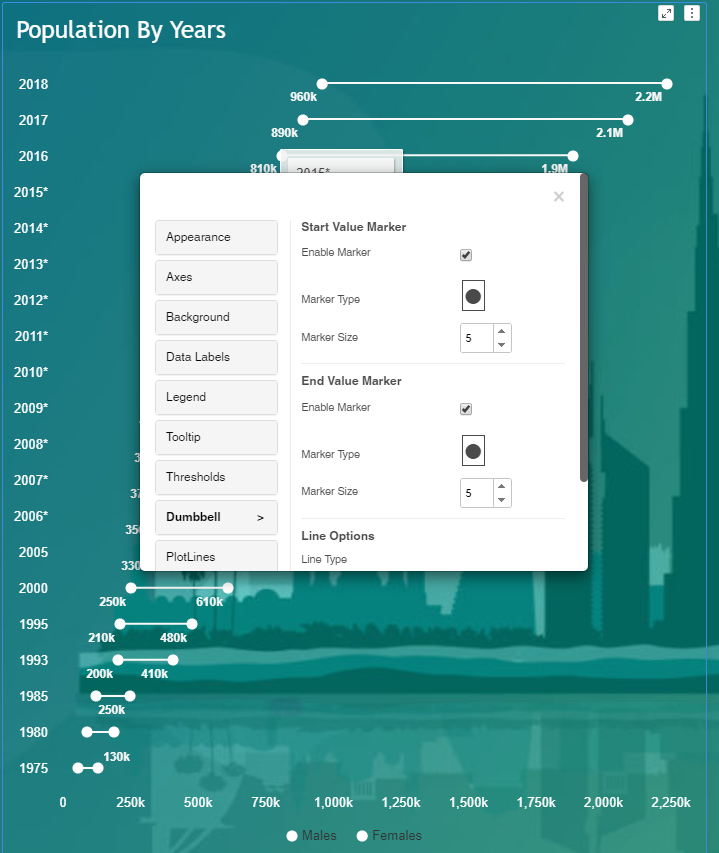
Population Growth By Years, Gender & Age Groups
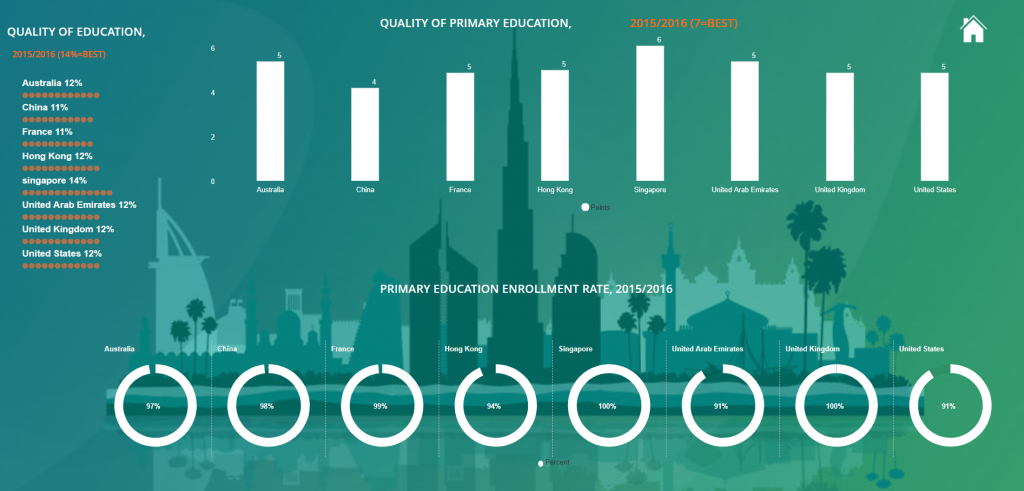
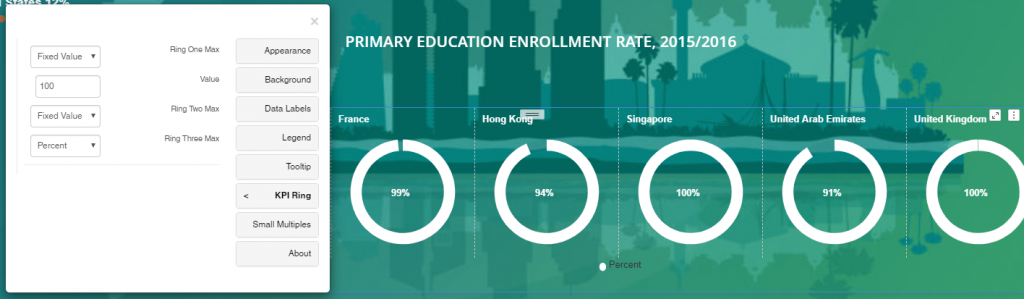
Quality of Primary Education
Manufacturing & logistics
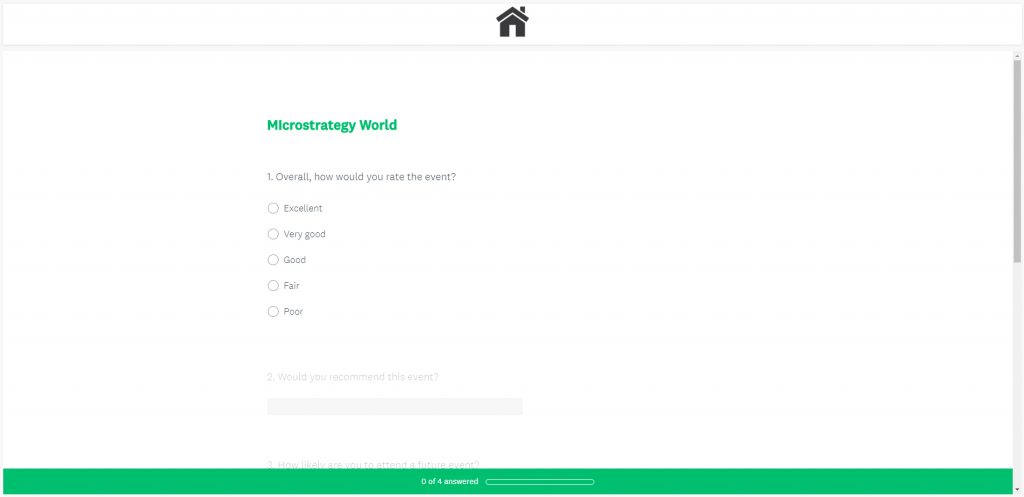
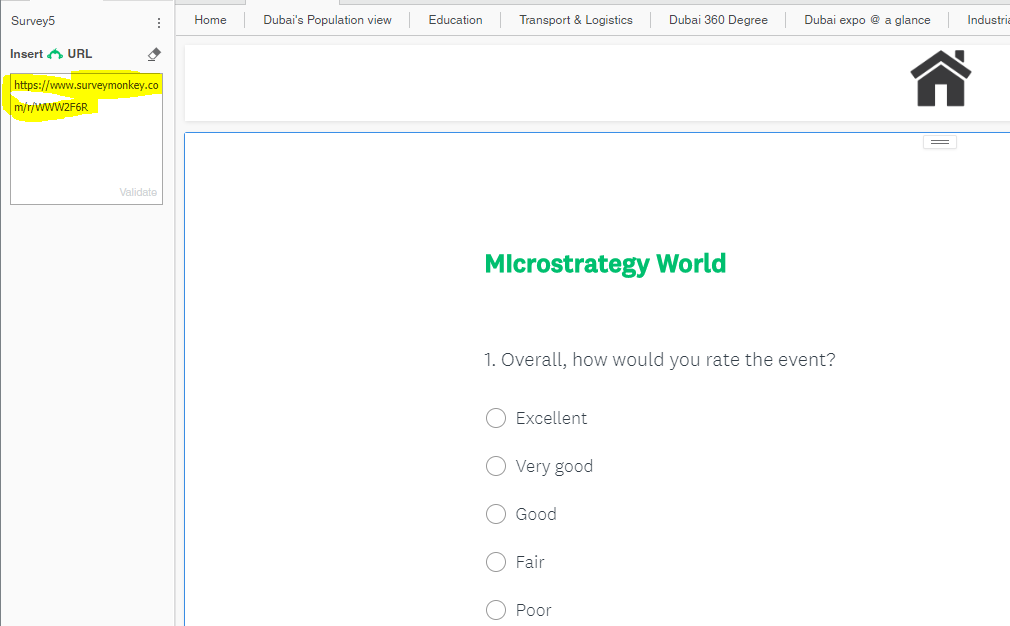
On top of these, Ram integrated with Survey using “Survey Monkey” into the Dossier (another cool feature to look out for – will share an post on it very soon!!)
Vitara : Tornado Chart
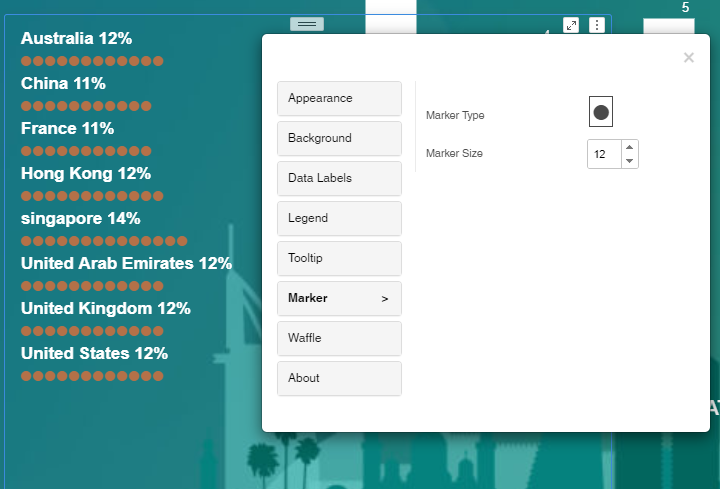
Vitara: Waffle Chart
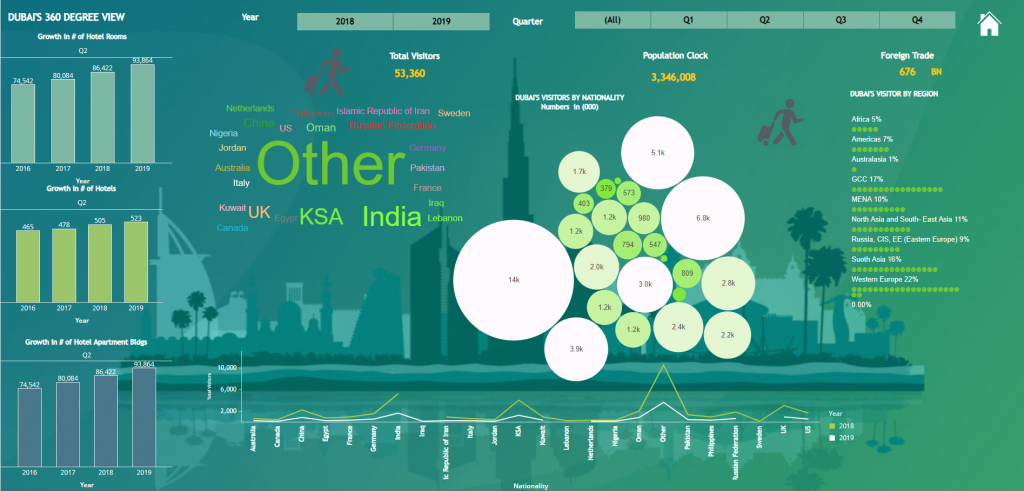
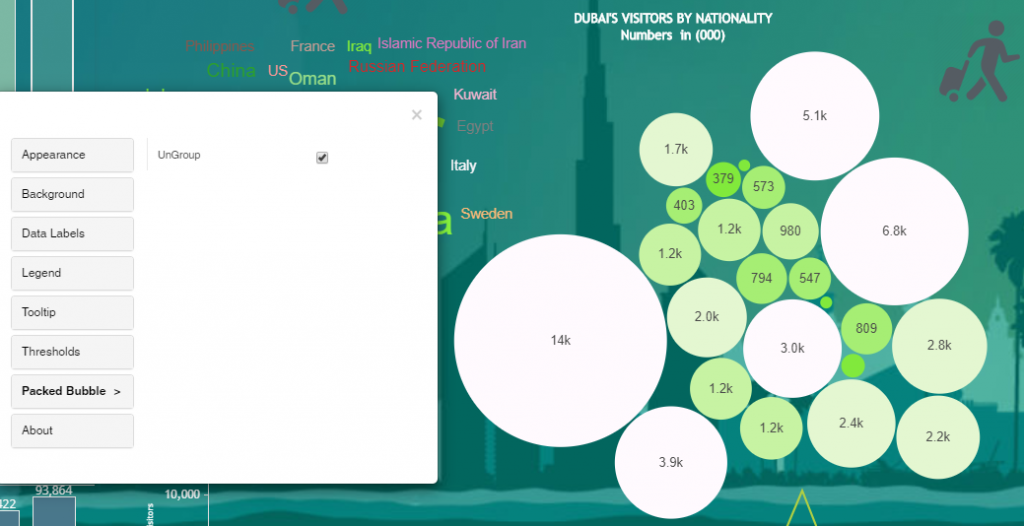
Vitara: Packed Bubble
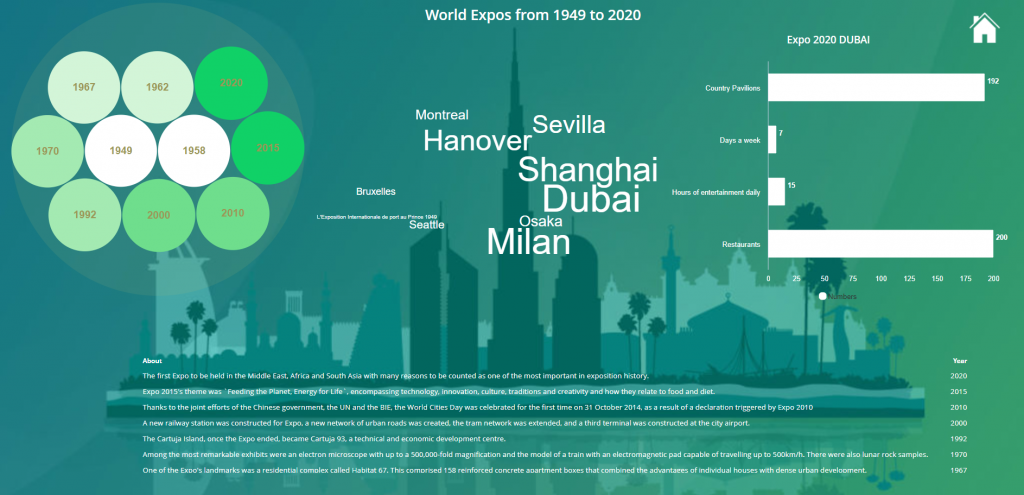
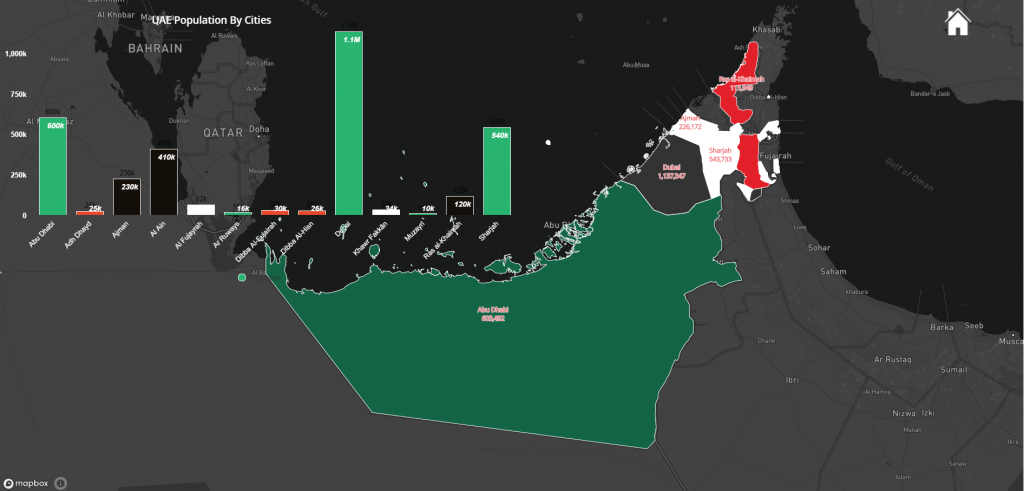
Tip: Geo Map (Geospatial Service Map from MicroStrategy)

Thank you Ram for sharing the knowledge and experience on building this Dossier to the audience!!
Some of the tips overall are below:
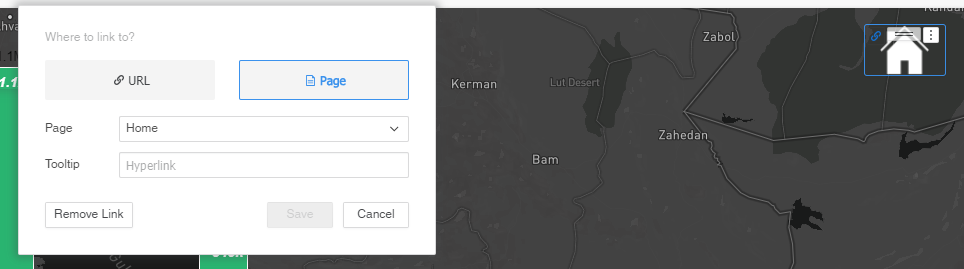
- Linking between Pages
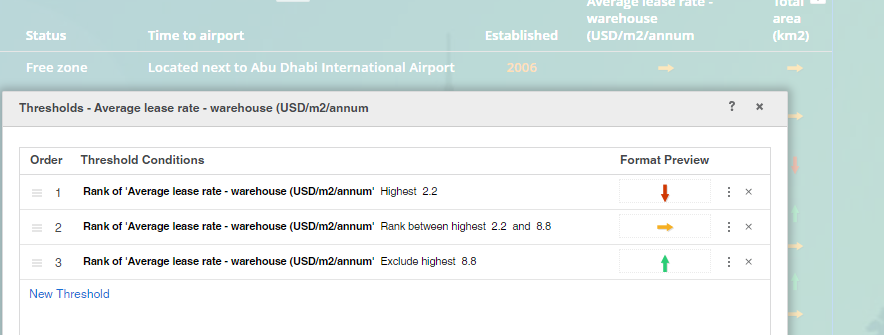
2. Thresholds based on Rank
3. Layering with “Freeform” canvas design
4. Embedding “Survey Monkey” based surveys on Dossier
5. Dumbell Based Graph style using “Vitara” charts
6. KPI ring based visualization using “Vitara” charts
7. Waffle Viz using “Vitara” charts
8. Packed Bubble viz using “Vitara” charts
Majority of the viz are by “Vitara” charts which makes the MicroStrategy freeform canvas design to the best in class competing with other BI vendors (such as Power BI or Tableau)
Thanks again Ram for sharing the tips and knowledge sharing here!!
Enjoy Reading!!