

I would like to share today about Satoshi Ganeko – Tableau Zen Master 2021 | 2019,2020 Tableau Public Ambassador | 2 x VOTD | Data Saber | Flight data analyst ~ his Viz / Dashboard build process for Datafam to get inspired from it.
I am truly honored to share his experience in my blog for the whole #datafam community. Thanks so soooo much to him for sharing it!!
Don’t miss to enjoy & learn from it!
Introduction by Satoshi
Hello everyone.
I am Satoshi Ganeko (Twitter: @ ritz_Tableau).
I have been using Tableau for 7 years in Japan and regularly participate in Makeover Monday (Twitter hashtag: #makeovermonday), Viz for Social Good (#vizforsocialgood), SDGs Viz Project (#TheSDGVizProject), etc. I was selected as Tableau Public Ambassador 2019 and 2020, and Tableau Zen Master 2021.
I am honored to have my article published on Rajavel’s (@ RcVels) blog. In this article, let me introduce a viz of Makeover Monday I created earlier this year. I would like to talk about what I thought while making this viz and how I used the techniques of Tableau.
In general, we call data visualization as “Viz”. Also in this article, I would like to use the term “Viz”.
Makeover Monday and My Approach
Makeover Monday is a project run by Andy (@ VizWizBI) and Eva (@ TriMyData). Every week, data on the subject and original articles for reference are introduced, and based on that, people all over the world do their own data visualization and post their viz.
For more information, please visit the Makeover Monday website below.
I have been participating in Makeover Monday since the end of 2018. More recently, I worked on subjects of past weeks and created viz for all weeks since 2017.
This time, I would like to introduce my viz posted for Makeover Monday, which is a subject for the 5th week of 2021.
Before introducing the viz, let me give you a quick rundown of process when I work on Makeover Monday.
My general process is as follows.
- First, read the source article on the Makeover Monday website to see what the data is.
- Next, open data with Tableau. While creating some viz, dig the data, and explore what columns there are, how many records are, which fields will be used for categorization and which fields are the numerical data to be aggregated, and so on.
- In most cases, I will not move on to the actual creation of viz for post. Close my laptop, have breakfast, go to work, or lie down and relax. While spending such a normal time, I think vaguely what this data represents, what kind of visualization is best suited to make the data understandable, and so on.
- With that in mind, I spend the night, sometimes a few days, while checking data with Tableau from time to time.
- Then I will build a viz that I envisioned with Tableau. If I need some advanced technique to achieve the viz that I envisioned, I will do it by trial and error.
This is the process.
However, if I think that the best viz for representing data is a simple bar chart or line chart, I do not hesitate to select them. I do not think of elaborate design from the beginning as the priority. On the other hand, if I need a technique to make the viz that I envisioned, I am pursuing it.
I also focus on doing most, or all if possible, of viz creation in Tableau. Of course, this is not to deny using other tools. It is just because I like Tableau and I want to explore how much I can do with Tableau.
About the original data
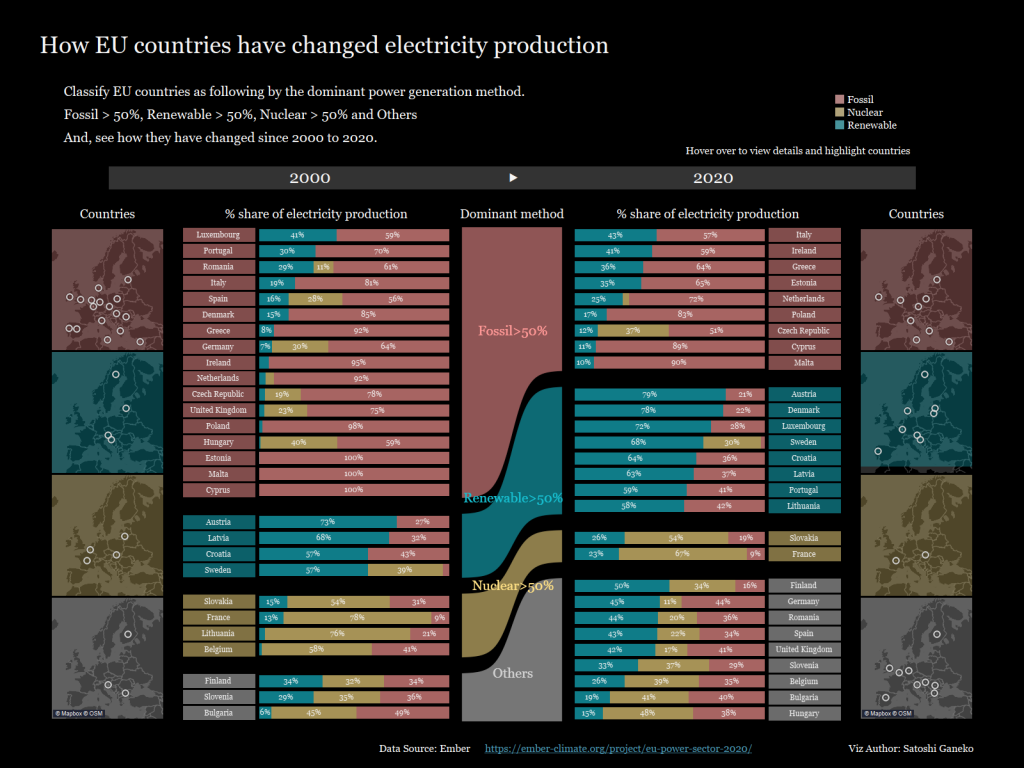
The introduction has become long, but the viz introduced this time is shown in the figure below.
Make over Monday week 5 in 2021
https://public.tableau.com/profile/satoshi.ganeko#!/vizhome/EUElectricityProductionMOMweek52021/DB
The original data shows the amount and share of electricity generated in each EU country for each year from 2000 to 2020, by method of power generation.
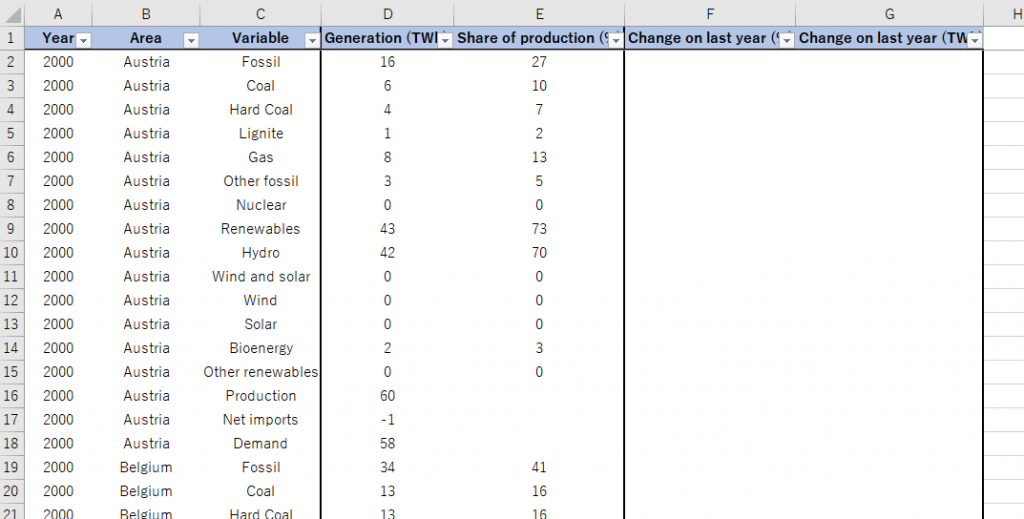
As above, the amount of electricity generated by each method in each country and each year, and its share in the total are shown.
The graph in the original article is shown below.
https://ember-climate.org/project/eu-power-sector-2020/
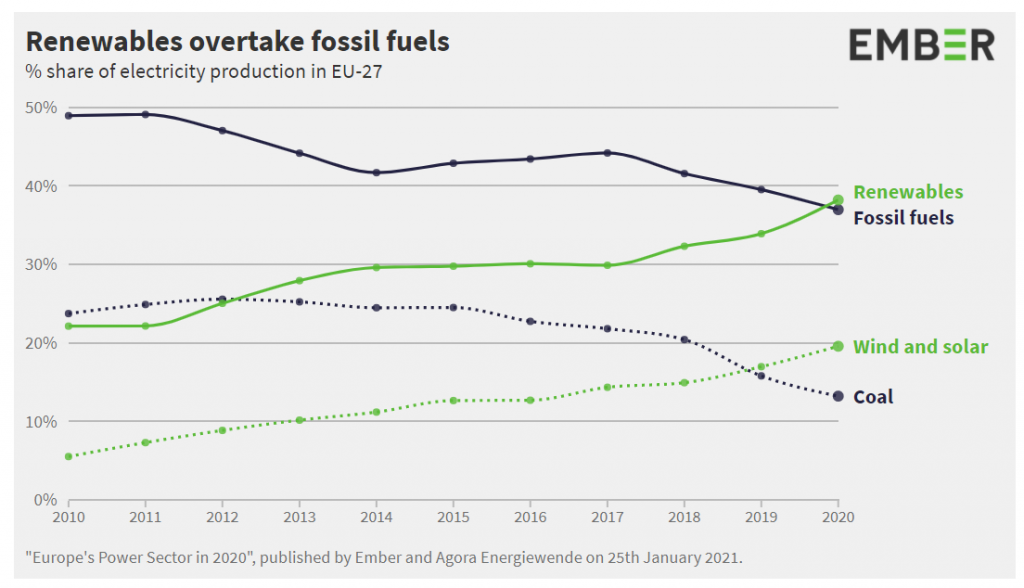
As the title says, “Renewables overtake fossil fuels”, in 2020, renewable energy generated more electricity than fossil fuels for the first time in the EU. We can see that the shift to clean energy is progressing steadily.
But the next question will immediately come to mind.
“There are many countries in the EU, but are they all shifting to clean energy?”
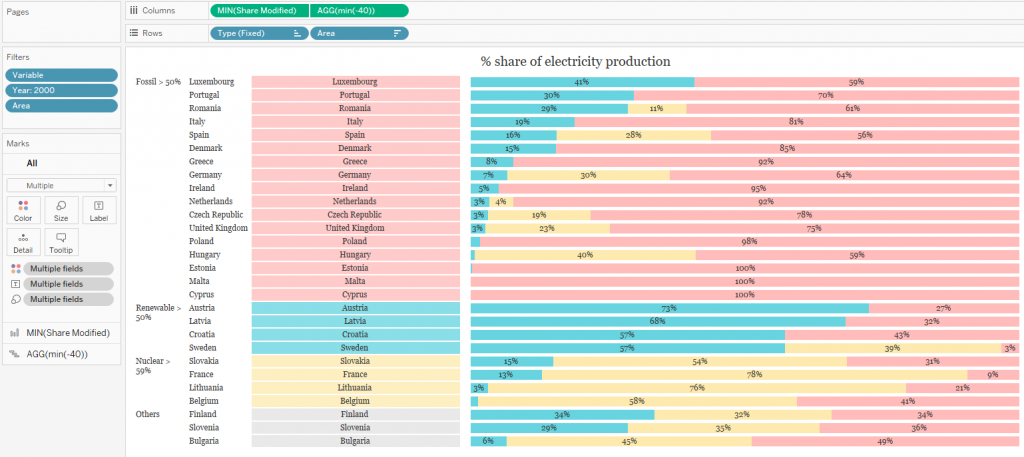
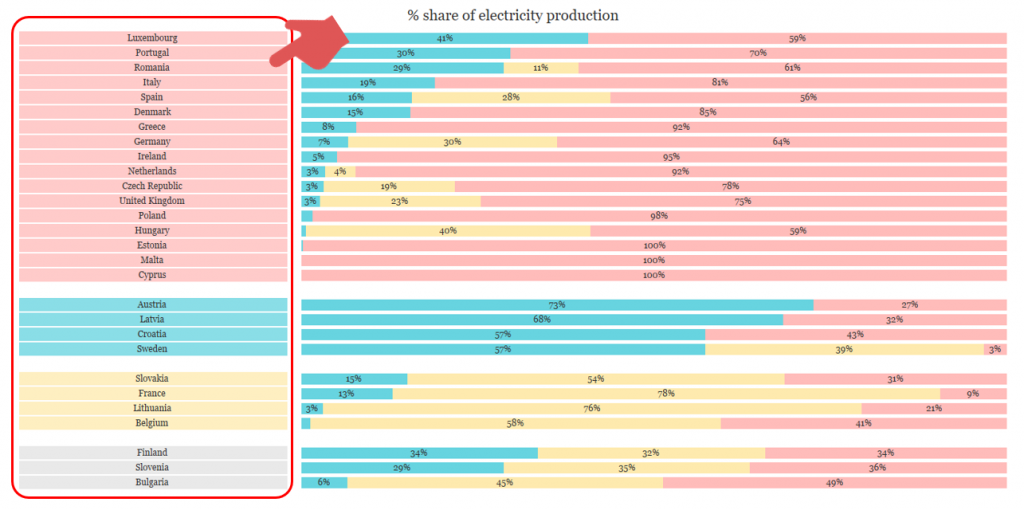
So, let us look at this original data by country. The chart below shows the breakdown of electricity generation by country in 2020.
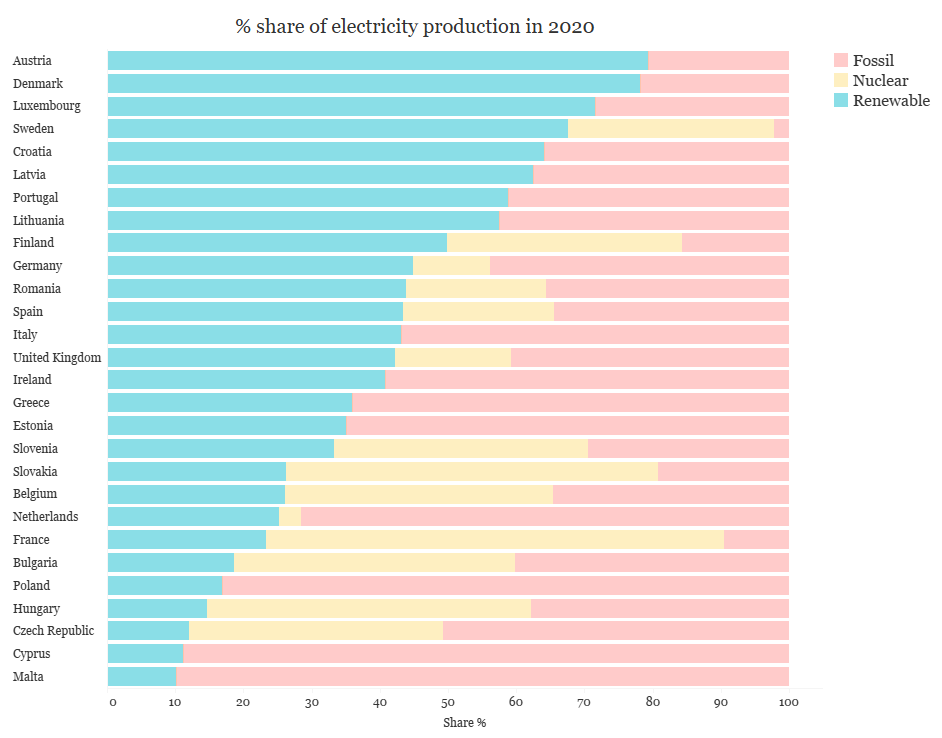
As you can see, the situation varies greatly from country to country. Of course, it is not a mistake to put these countries together as a trend of the EU, but I think that it does not convey all fact this data represents.
Therefore, I set the following two points as the goals of creating the viz.
・To show that the EU as a whole is shifting to clean energy.
・To show that there is a big difference between countries, and some countries are shifting to clean energy and others are not.
I decided to look for a visualization that could simultaneously fulfill these two points. I remember it took a few days to decide how to visualize.
Finally, I came up with the idea of showing the share of Fossil, Renewable, and Nuclear in the amount of electricity generated by each country, then dividing each country into four categories according to the dominant power generation methods.
The four categories are “Fossil is more than half “, ” Renewable is more than half”, “Nuclear is more than half” and “none is more than half”.
Then I expressed the change in the number of countries for each type in the whole EU, to express the shift to clean energy of the whole EU.
That is the concept behind the viz.
Viz layout
The viz is divided into five components.
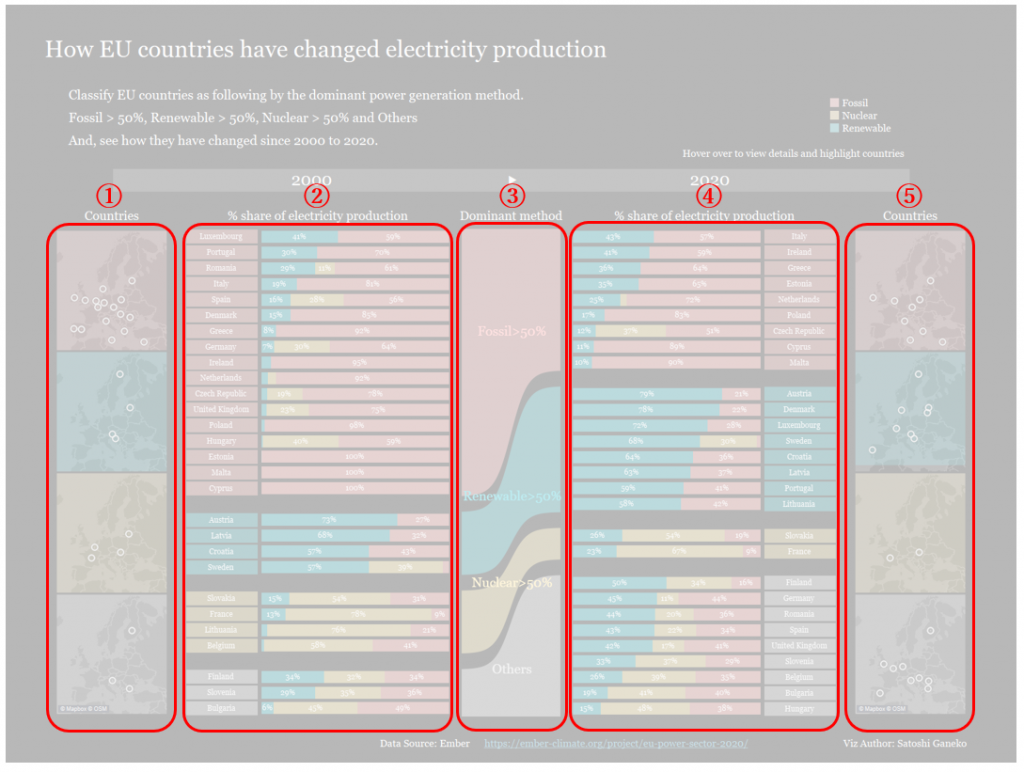
From left to right:
- (1) Map of countries classified by dominant generation methods in 2000
- (2) Chart of the breakdown of power generation methods by country in 2000 and classification by dominant generation methods
- (3) Sankey diagram connecting 2000 data on the left and 2020 data on the right. This part also serves as a color legend.
- (4) Chart of the breakdown of power generation methods by country in 2020 and classification by dominant generation methods
- (5) Map of countries classified by dominant generation methods in 2020
Each viz uses various Tableau techniques. Although some of them might not be useful in a business use, let me explain.
There are some parts that cannot be expressed in sentences. You can download the workbook from Tableau Public below and dig it.
https://public.tableau.com/profile/satoshi.ganeko#!/vizhome/EUElectricityProductionMOMweek52021/DB
① & ⑤ Maps
The light color of the background is displayed using a large square with a dual axis.
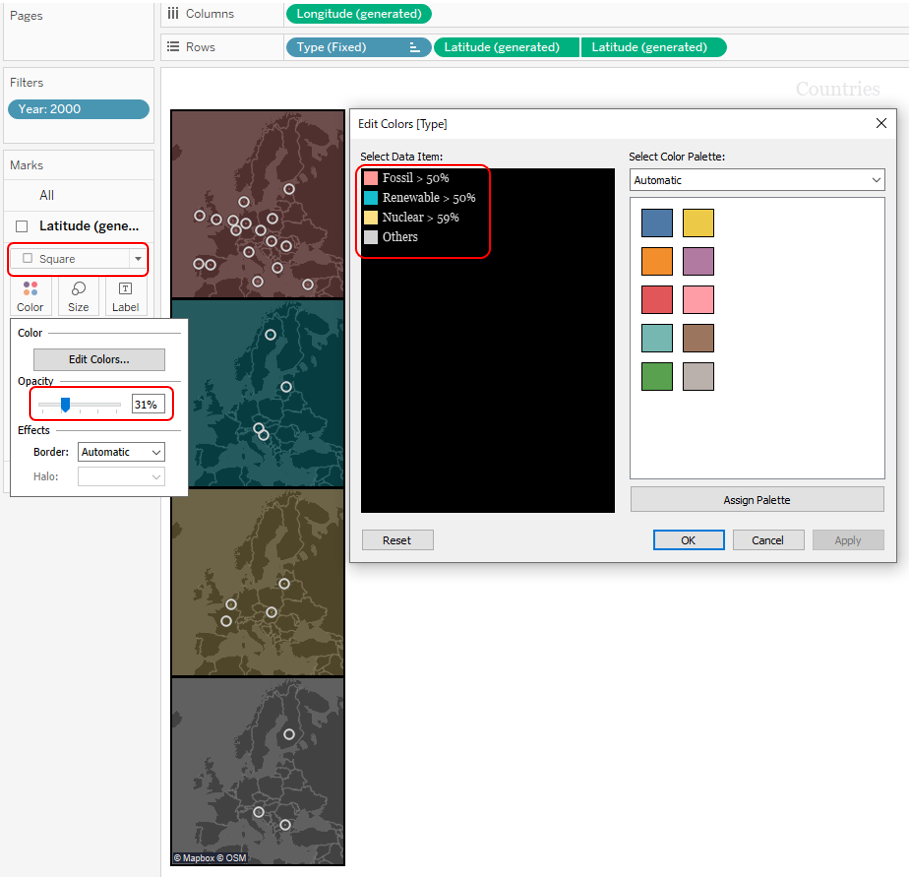
If I use the background color of the worksheet or the banding pattern as the background color, I cannot use four different colors for each pane. Therefore, I make background colored with representing the country by a large square with a dual axis and coloring with high transparency. However, if you add transparency, the part where the country square overlaps become darker.
So, among several countries that fit each category, only one is displayed with a dual axis and made translucent.
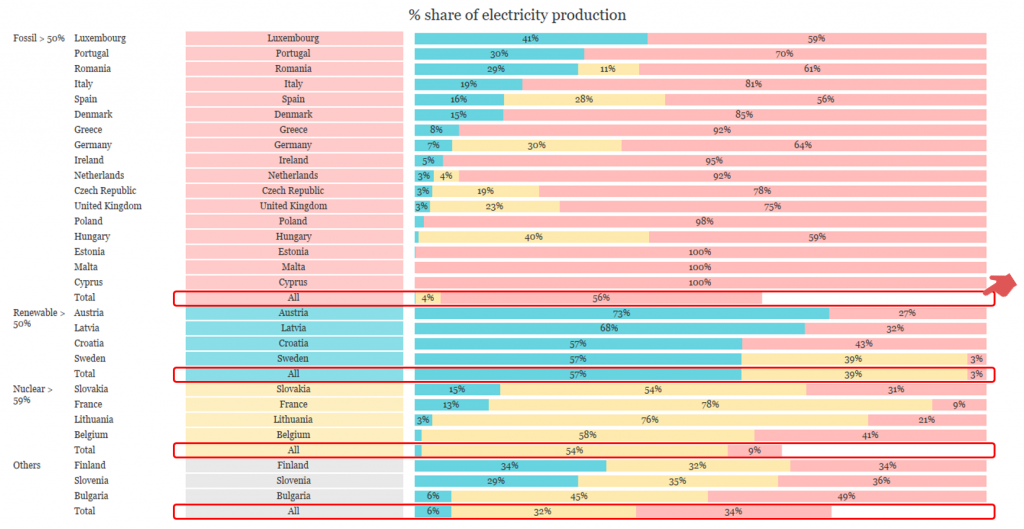
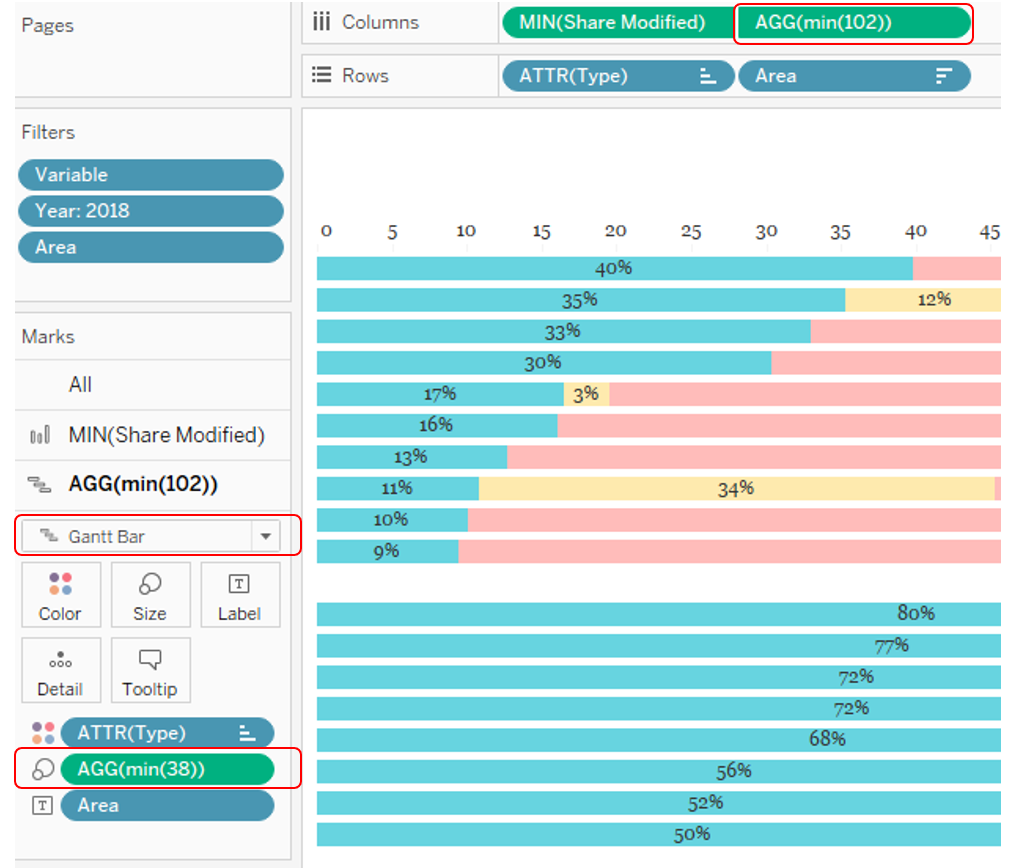
② & ④ Bar chart by country
This chart is characterized by spaces between categories.
It uses subtotals functions. I learned these tips from @VizWizBI(twitter), @SimplVizBest_YK and @O_Syringa_Z.
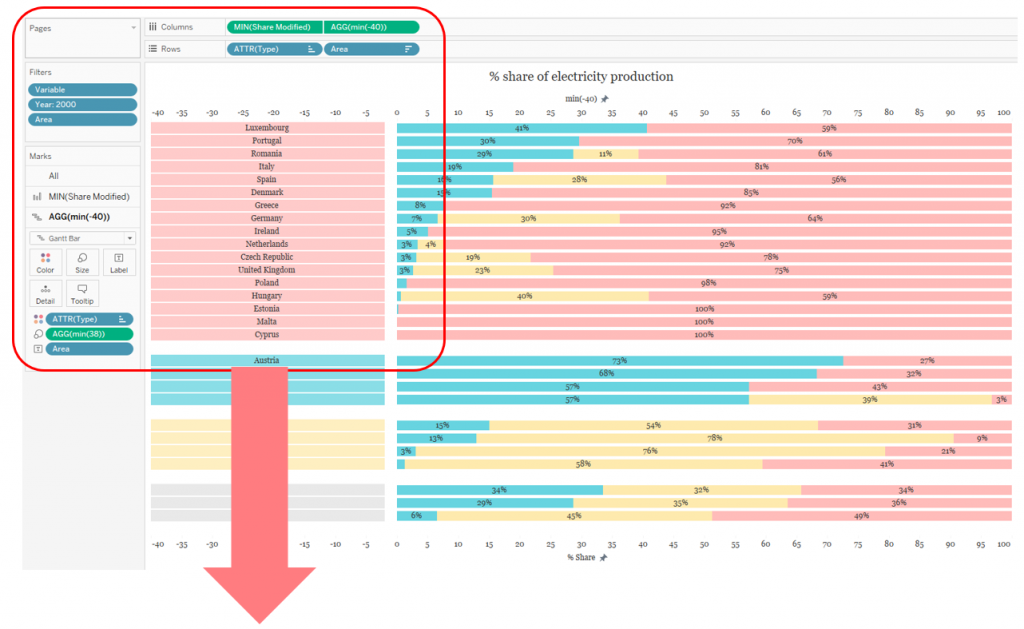
The original viz without subtotal is as following.
Set the following settings for the viz shown above.
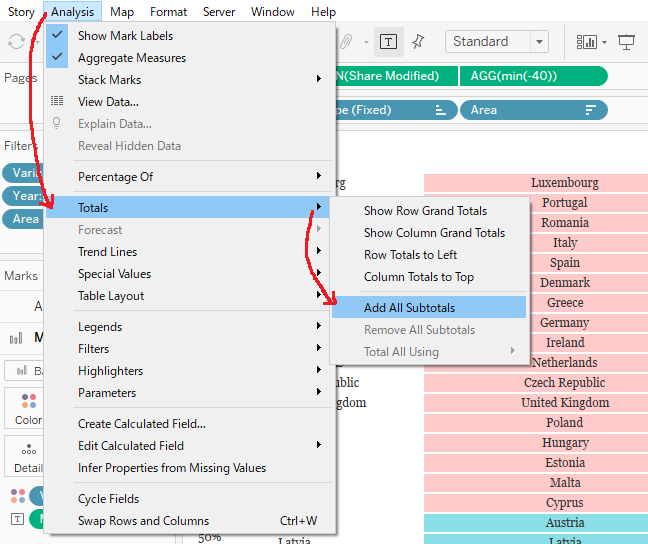
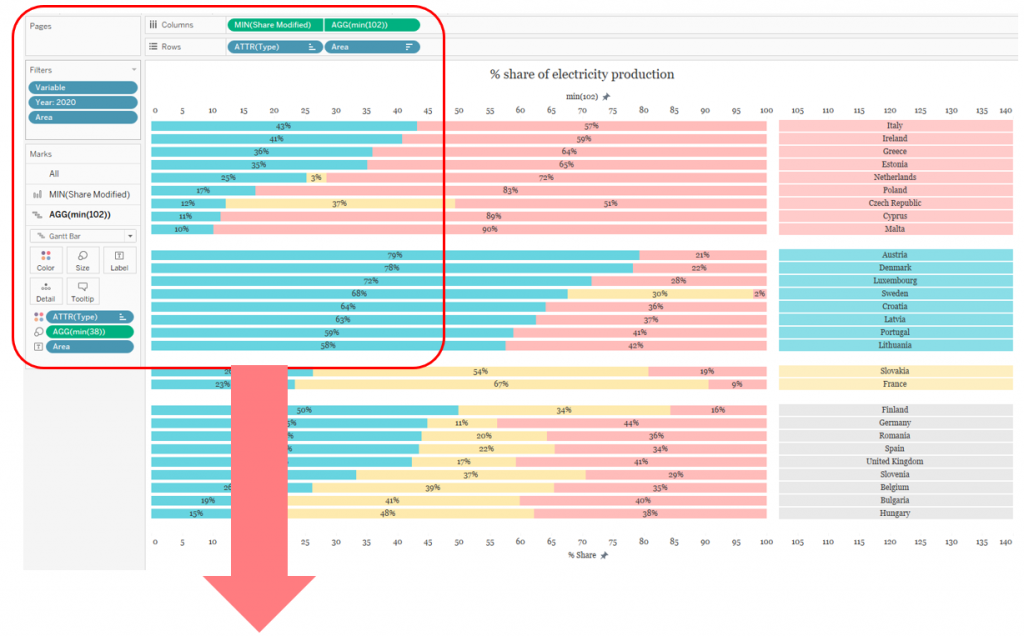
And so,
It becomes like this. Totals are shown.
Then, change settings for ‘Total using’ of measures on column shelves to ‘Hide” as following.
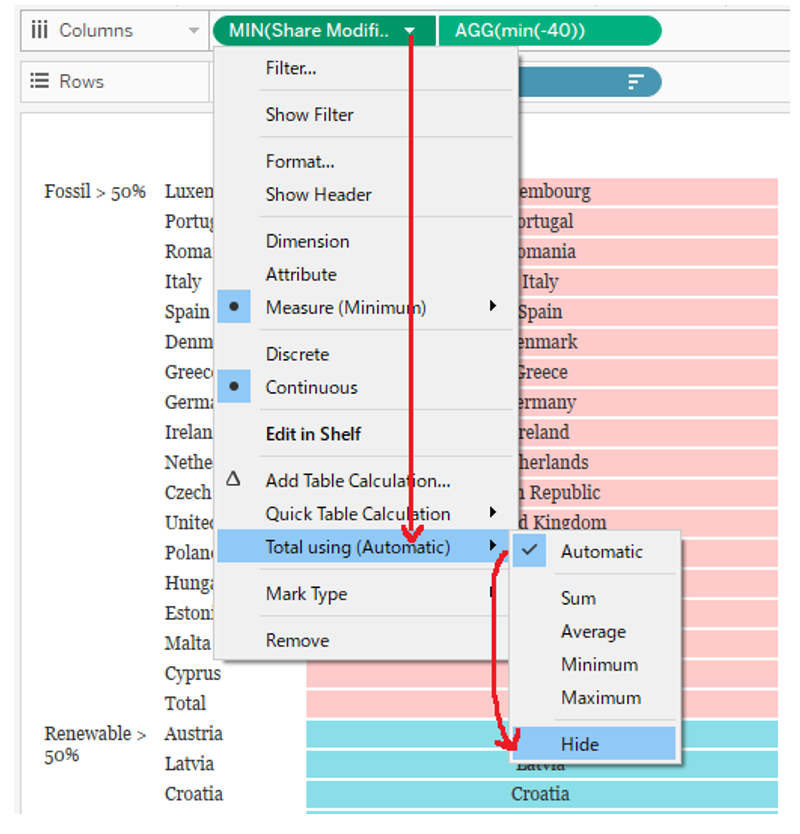
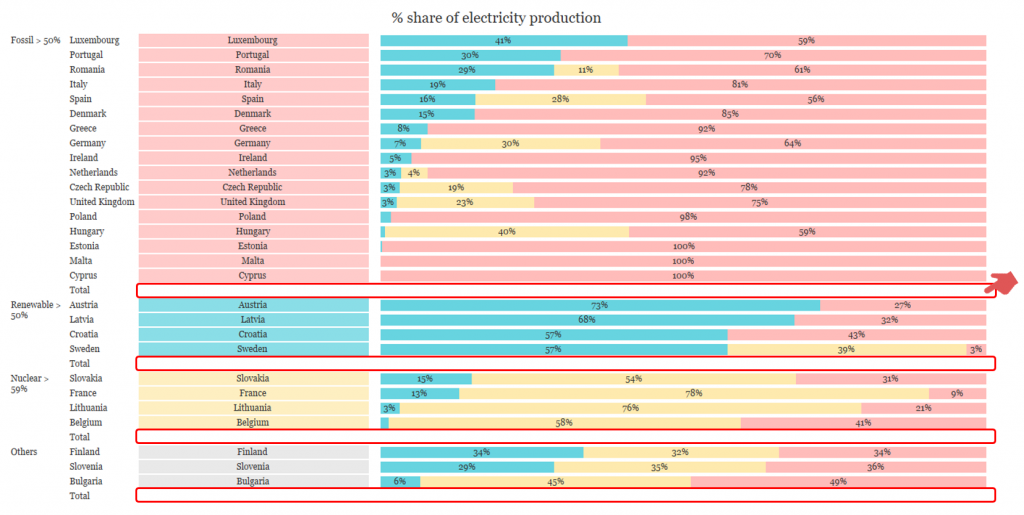
So, totals will be hidden as above.
In the viz, I hide the headers of the two pills on the row shelves.
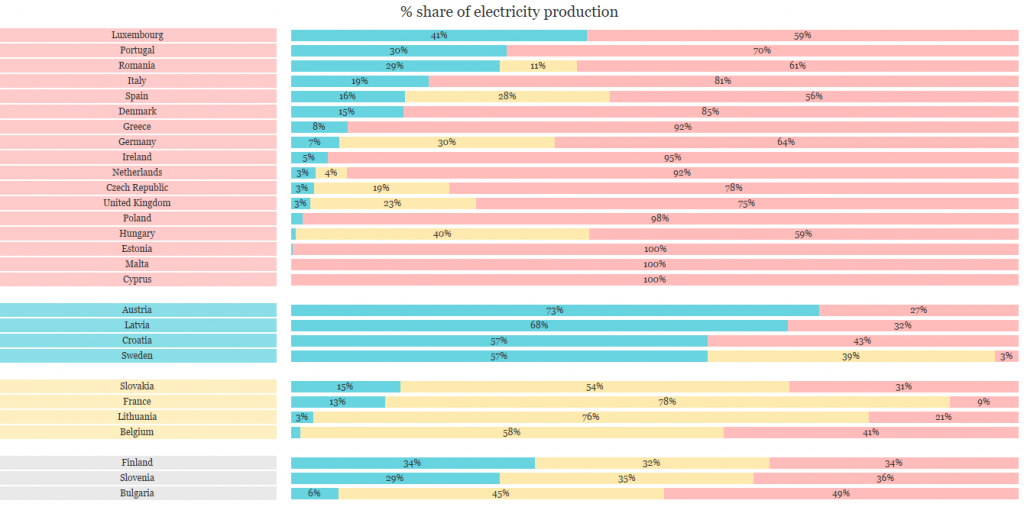
Another feature is the left label background.
Displaying headers normally does not change the background color.
Therefore, by using a Gantt chart with a dual axis and adjusting the range of the axis, it is arranged like a label on the left and right of the bar charts.
Left: the chart for 2000
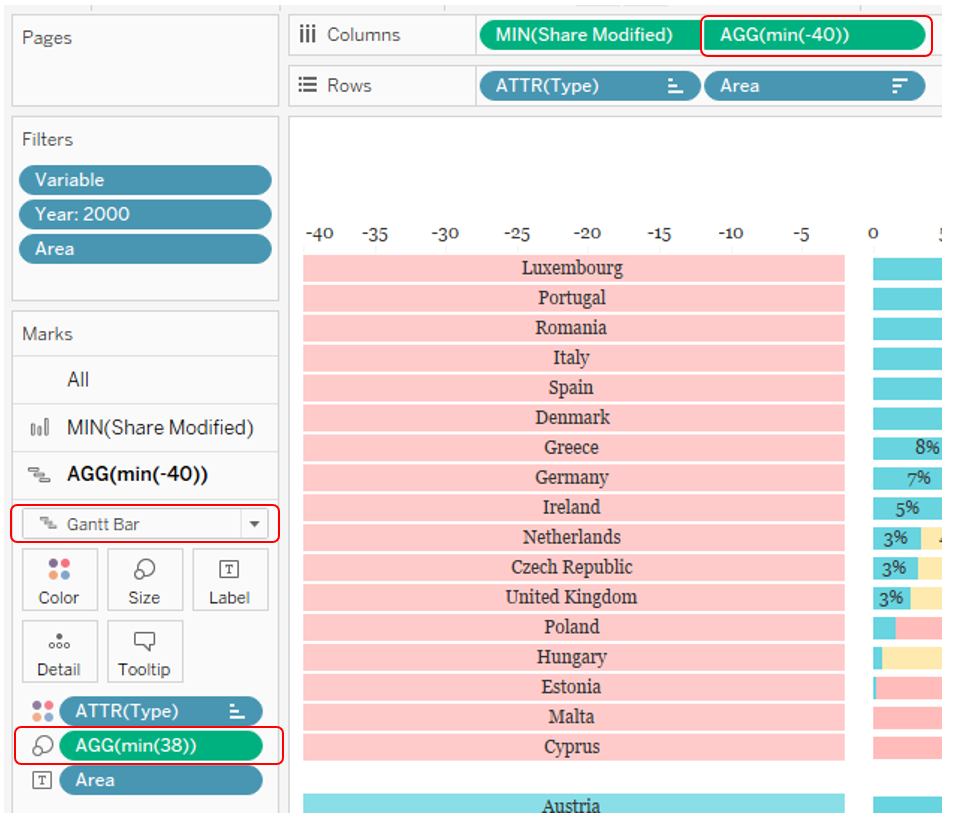
Right: the chart for 2020
With hiding the axis, it becomes the label with different background colors.
③ Sankey diagram
Sankey diagrams are good for showing the time variation, flow, and so on of quantities.
This time, I used the Sankey diagram to show changes in the number of countries in the country classification by connecting the left and right sides.
In the viz, the left is fixed at 2000 data and the right is fixed at 2020 data.
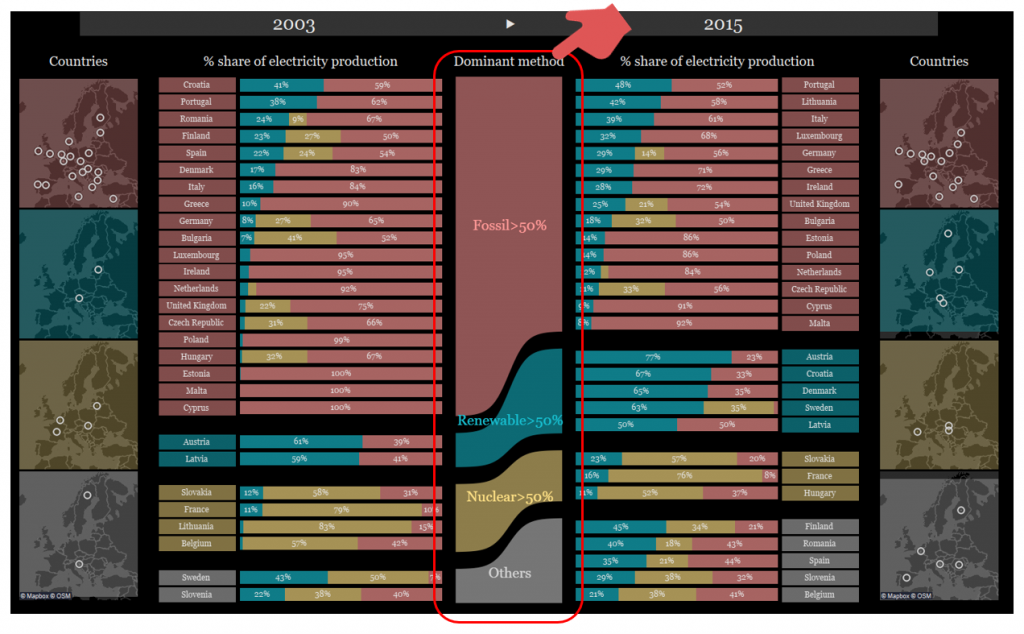
However, the Sankey diagram itself is set so that the shape changes in conjunction with the year of the left and right data.
Example: 2003 on the left, 2015 on the right.
Probably, you might think,
” If you can change the year, why don’t you arrange so that you can change the right and left years freely with parameters?”
or
” If you fix the left and right years to 2000 and 2020, isn’t it necessary to make the Sankey diagram so that it will adapt to the change of the year on left and right?”
There is also an idea this.
However, for the purposes of the viz this time, it will be better to use the first year and the last year of the original data.
I thought, it was not necessary to set the interactivity to let the viewer change years.
On the other hand, in creating Sankey diagrams, I aimed to make it be able to adapt to changes of years, to improve my skills and take on some challenges.
To create this Sankey diagram, we will need some complex tableau calculations and skills. I will omit the detailed explanation because it will be too long, but if you are interested, download Tableau workbook, and dig it please.
The outline of making this Sankey diagram is as following.
- The data source is a union of the original data itself.
- Calculate the vertical position of the left and right parts of a Sankey diagram using table calculations with the left and right year data.
- I have a blank line between the classifications, I need to adjust the vertical position of the Sankey diagram accordingly.
- It then uses data densification and sigmoid functions to calculate X and Y to create the polygon.
For more information on Sankey diagrams, please refer to the following web sites.
KEVIN & KEN FLERLAGE’s Blog
https://www.flerlagetwins.com/2019/05/intro-to-data-densification.html (About Data Densification)
https://www.flerlagetwins.com/2018/04/sankey-template.html
These ①-⑤ viz are combined to make the whole thing.

This viz uses advanced techniques. Especially, creating the Sankey diagram is difficult.
However, the reason I favor this viz is not because I could use such a technique, but because I feel that I could realize my original attempt, “To show the overall trend of change while showing the situation of each country.”
I feel that when data, visualization techniques, and techniques for using tools are well integrated, valuable data visualization comes about.
Let us enjoy the world of data visualization together.
Thank you so much for reading.
Satoshi Ganeko