Note: this widget was created by Dong-Hyub Lee, Senior Sales Engineer – Korea (Credit to his work!! – Great Viz!!)
Thanks to Reema Mohanty for publishing this post & sharing the knowledge to other bloggers!!
Great experience on working with Card Widget from her with MicroStrategy Dossier.
Description: Many a time we need to have a better visualization that would represent the data in a more effective way; for instance when we represent map visualization a better way could be to have country flag as selectors based on which you can filter out detail values in map visualization, rather than having the basic country filters in the filter panel.
The following steps would explain how we can achieve this card visualization.
Perquisite: Most of the special visualization is not by default available in Dossier, we need to import this in order to get the best out of our data.
Here we need to import the Card Widget visualization in order to create this visualization.
Here is the attached file which you need to download and upload it in Dossier for the next steps.
Step 1: Upload the visualization through Dossier custom visualization, click on “Import Visualization” and select the CardWidget that you have downloaded.
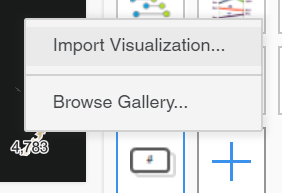
Once it is imported successfully the card visualization would appear like this  in the custom visualization area.
Step 2:
To populate the flag images in the card, we need to associate the flag address path like below:

Step 3: Next we will go ahead to pull the necessary data items.
We would need 1 attribute and 1 metric to create this card widget.
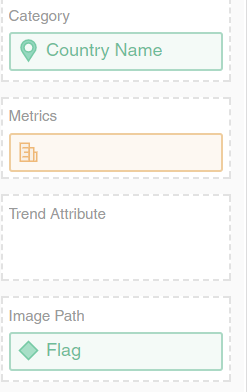
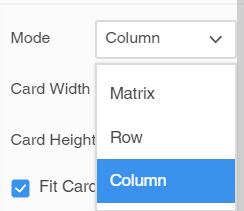
Step 4: In the settings panel make sure to select only Fit Card to Visualization under Configuration category. This will help to fit all the Data point in the specified Visualization area. You can adjust the height and width of the card to alter the size .

The mode selection helps to select the way you want the card to be displayed.

Step 5: After populating the Card Widget by following the above steps, create a map visualization that would help to target from the Country Flag widget which we have created.
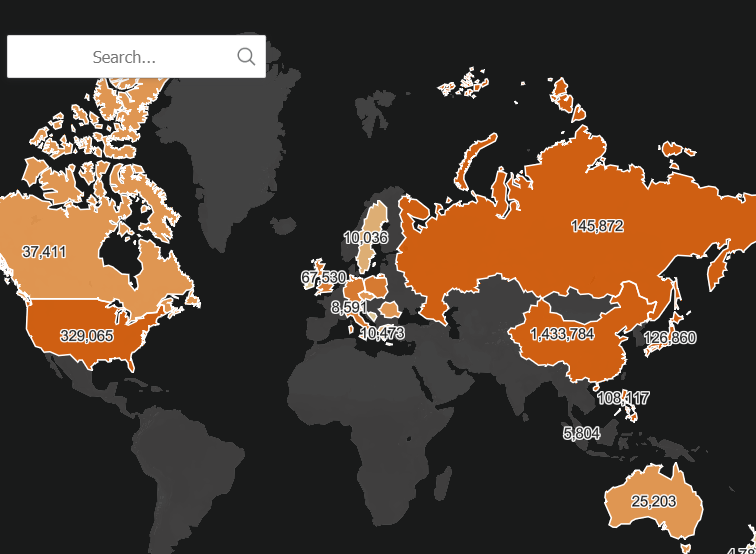
Step 6: In order to filter the second visualization, select on the “Select Targets “from the Flag Visualization tab.

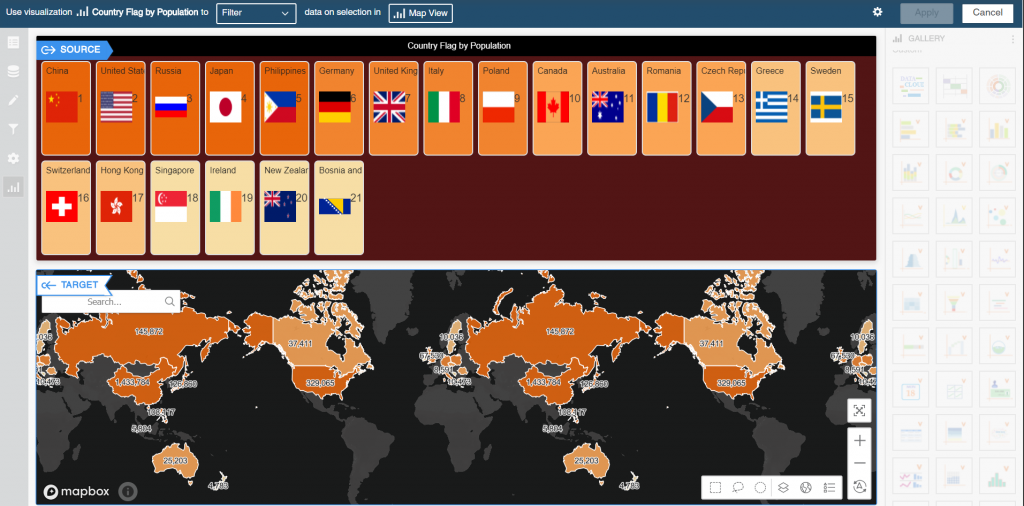
Make sure you select to Filter /Highlight the target visualization and click apply.
Step 7: After the targets are set click on any country flag to see the details for the corresponding Country selected.
Here I have selected Germany, to view its details.
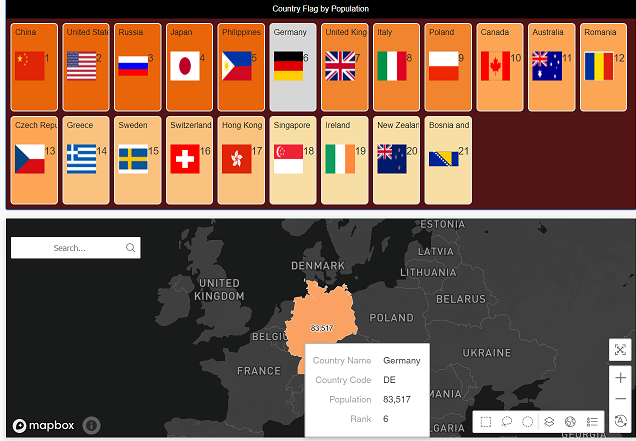
Step 8: To deselect the selection click again on the same card to return to normal mode.

