
by Vels | May 27, 2020 | Tuesday
If you are an dashboard designer at your organization, you would know how pain it is to format the dossier with better look and feel. As we discussed earlier, it is highly important to have focused wire-frame/dashboard design in place to achieve your goal. With...
by Vels | May 20, 2020 | Wednesday
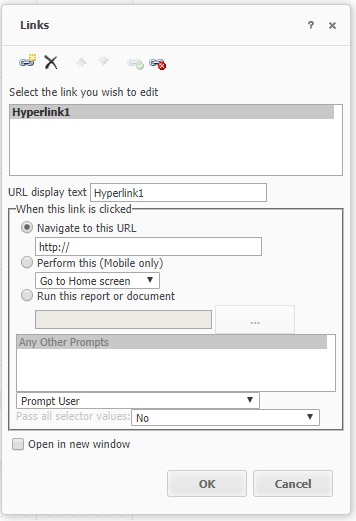
From MicroStrategy 2020, you can use visualization in one dossier to filter data in another dossier. Much of like Report Service Document or Report Linking feature introduced within Dossier as well. RSD Linking Report Linking For Dossier, It has to match source viz...

by Vels | May 12, 2020 | Tuesday
The skew or shape of the distribution can give valuable insights at a glance. The Barcode plot is very effective at showcasing the distribution across categories. The chart below has been built using Vitaracharts for Microstrategy. Credit: Vitara Charts For this Viz...

by Ramkumar Venkatasubbu | May 10, 2020 | Sunday
I know, this is an late post of sharing the beautiful dashboard story telling by Ramkumar Venkatasubbu I should say, this is purely great design by Ram in covering the story of valentine’s day spending across the globe. Below page clearly shows, 73% on buying...

by Vels | May 9, 2020 | Saturday
MicroStrategy Interview Questions Below were my list of questions to be aware as an basic MicroStrategy Developer from my personal experience (dusted from my backup to share with you all) Schema ObjectsAttributes...
